Interactive infographics for eLearning
We love creating interactive infographics so we were delighted when Challenge #103 was set on the E-Learning Heroes Website.
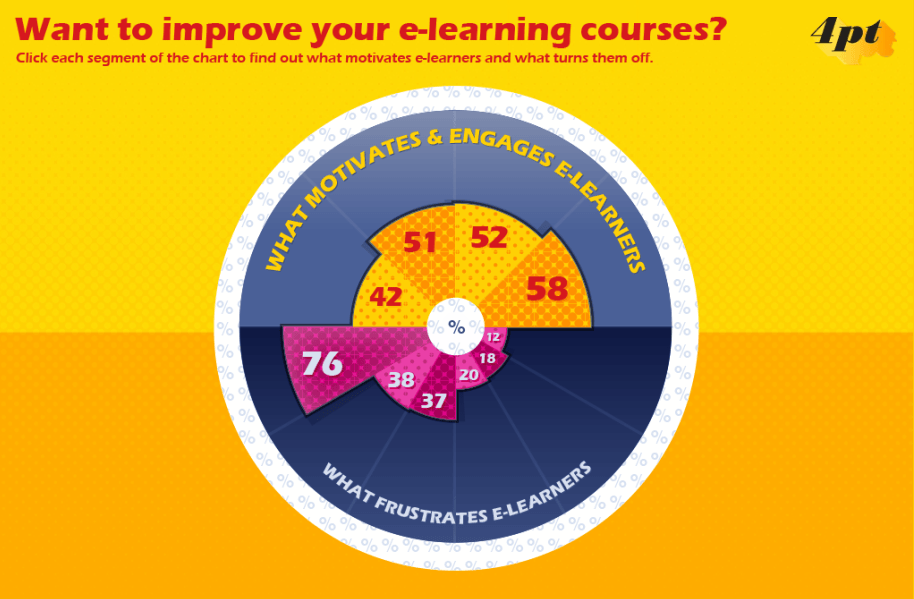
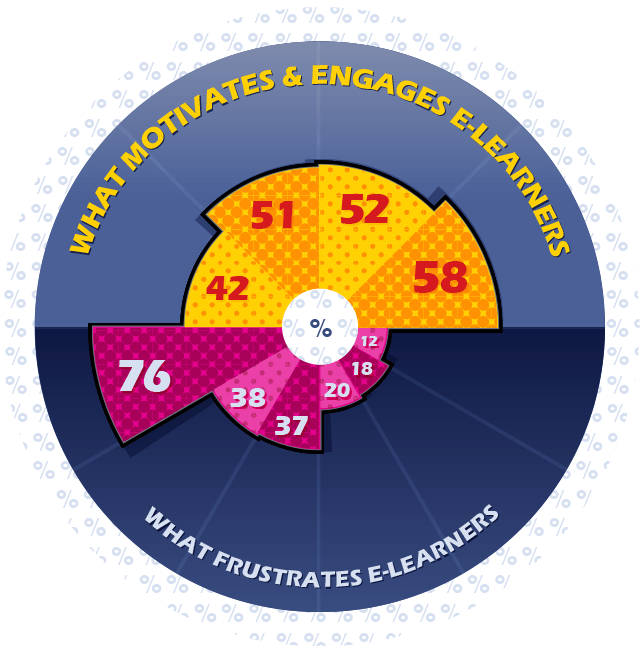
Articulate surveyed more than 500 people to find out what they really thought about eLearning. They asked them why they took online courses and to share their likes and dislikes. The survey results were used to build an infographic covering what people love and hate about eLearning. The challenge was to create an interactive graphic using the data from Articulate’s static infographic.
The original infographic was very tall and the dimensions didn’t really fit the traditional eLearning format, where we prefer to avoid scrolling. In our example we wanted to contain everything within a single view so we narrowed our focus to two areas from the survey:
- What Motivates and Engages eLearners, and
- What Frustrates eLearners.
With a smaller data set we were able to put all of the information on to a single slide, the inclusion of simple click to reveal functionality added a sprinkle of interactivity to the infographic.
eLearning Opinions: Is eLearning Good or Bad
Click the button below for an insight in to what Motivates, Engages and Frustrates e-learning users.
Related eLearning Posts
AI Avatars You Can Talk To. And They Talk Back.
What if learners could speak to an avatar right inside Storyline? That’s what this demo explores.

eLearning Translation and Localisation
Drawing on our experience, this article explores eLearning localisation approaches, from XLIFF files and Word translations to AI tools, highlighting their benefits, challenges, and how to choose the best fit for your needs.
AI Avatars in eLearning
Read our first hand experience of using AI Avatars in eLearning courses, and find out what clients really think.

David began his eLearning career in 2000 after earning qualifications in Graphic Design and then Newspaper, Magazine and Infographic Design.
During his time working in the eLearning industry David has gained extensive experience designing and developing eLearning content for clients based in the UK, Canada and the USA. To date, David has created eLearning courses covering a broad spectrum of topics, ranging from Pharmaceutical, Healthcare, Retail and Sport through to Pet Nutrition, Marketing, Sales and Tourism.
He is passionate about creating well-designed and purposeful eLearning solutions. David is a current Articulate E-Learning Heroes Super Hero.


