
Creating Interactive Infographics
Now and then I like to have a bit of fun and create interactive infographics based on topics that bear no relevance to the day job.
Doing this keeps me fresh and allows me to try new ideas and techniques that usually find their way in to future projects.
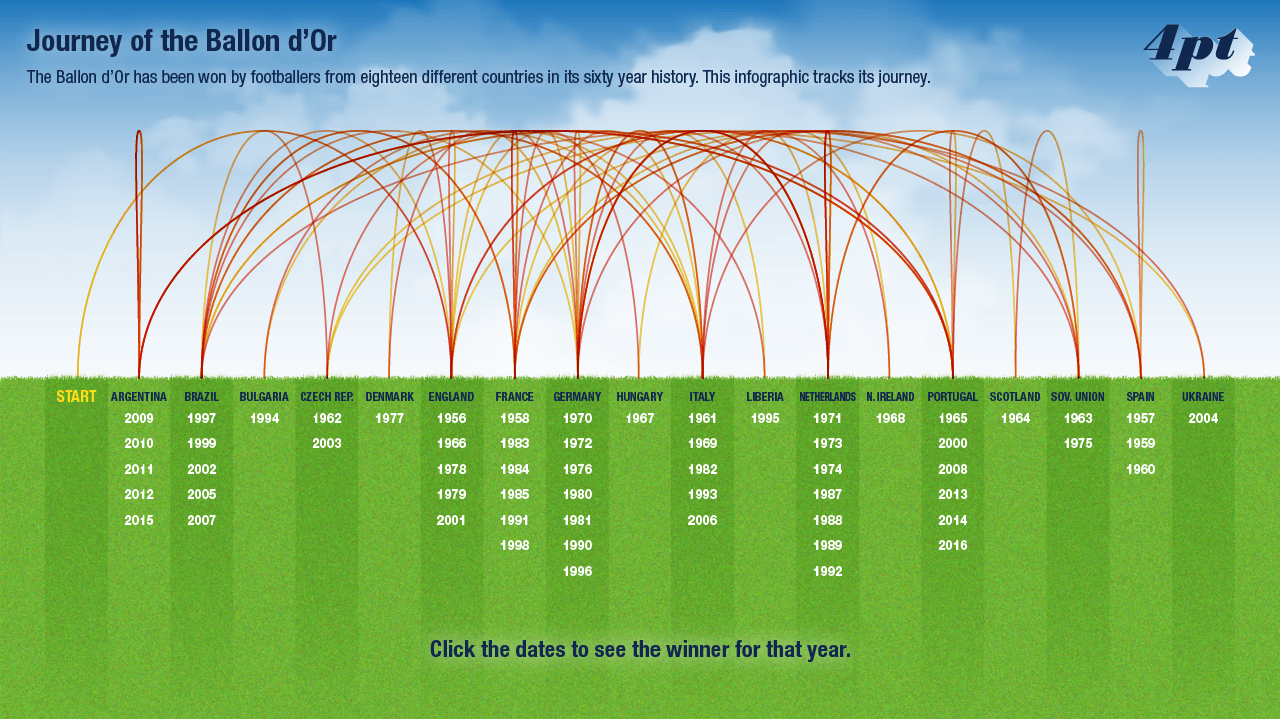
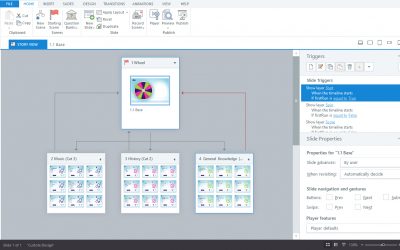
My latest infographic, made interactive using Articulate Storyline, tracks the journey of football’s Ballon d’Or award and the nationalities of the winners.
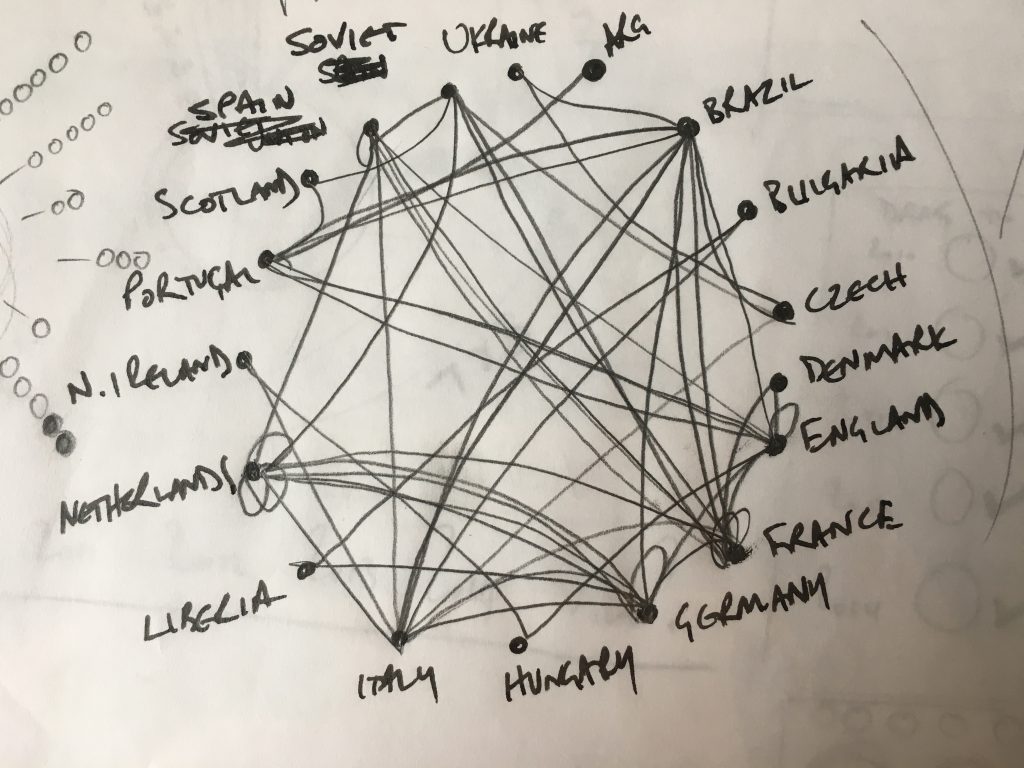
I’d been thinking of a way to show the connections between winners for a while and my original idea was to use a circular format as shown below.
In the end I didn’t think the circular format maximised the screen real-estate I was working with so I reworked the design. You can see the finished layout below.
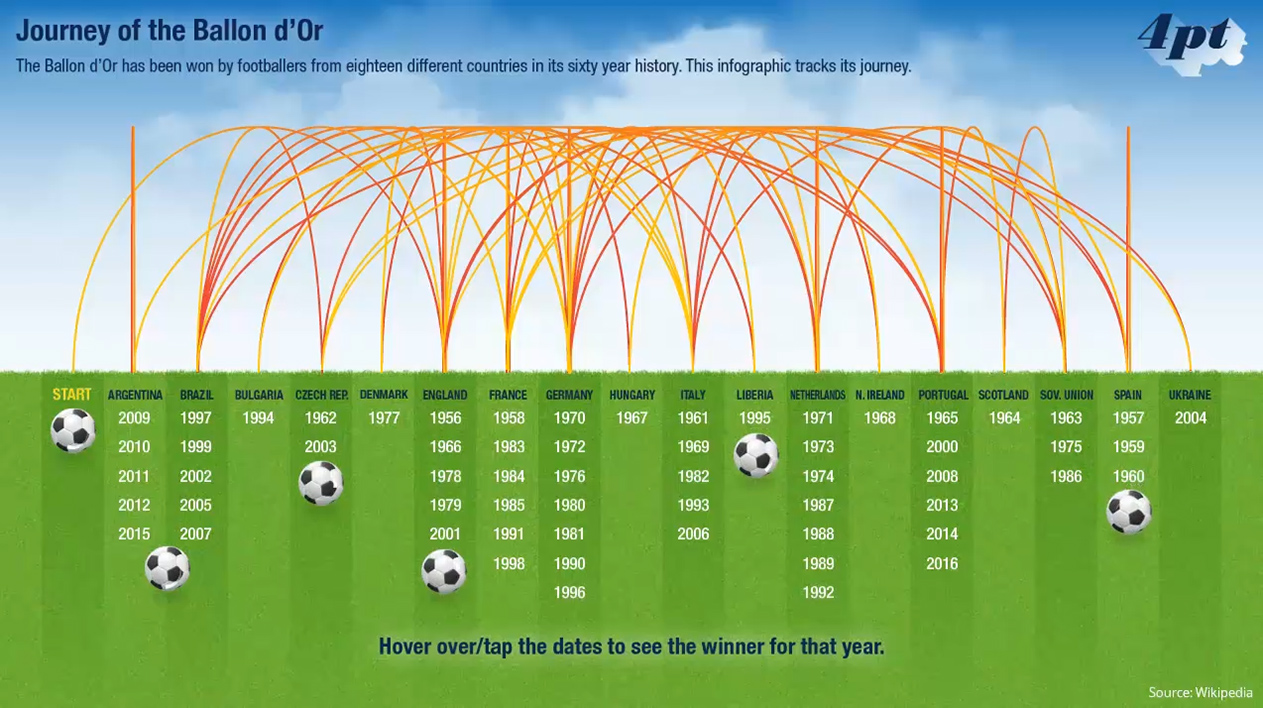
Interactive Storyline 360 Infographic
It was a lot of fun designing and building this interactive infographic, click the button below to start your Ballon d’Or journey.
Related Posts
Insight: eLearning Demo Build
Take a look under the hood of our latest demo for an insight in to creating bespoke eLearning solutions.

Speech Recognition
Storyline interaction with speech recognition using Javascript.

Playing with graphics tablets – UGEE 2150
To escape the monotony of the mouse we recently purchased some artist’s graphics tablets to play with.

David began his eLearning career in 2000 after earning qualifications in Graphic Design and then Newspaper, Magazine and Infographic Design.
During his time working in the eLearning industry David has gained extensive experience designing and developing eLearning content for clients based in the UK, Canada and the USA. To date, David has created eLearning courses covering a broad spectrum of topics, ranging from Pharmaceutical, Healthcare, Retail and Sport through to Pet Nutrition, Marketing, Sales and Tourism.
He is passionate about creating well-designed and purposeful eLearning solutions. David is a current Articulate E-Learning Heroes Super Hero.